Junior Education Data Scientist: Launch Your Career
Eager to apply your data science skills to the education sector? We are seeking a motivated Junior Education Data Scientist to analyze data, develop insights, and contribute to improving educational outcomes across the United States.
Essential Skills for Junior Education Data Scientist
Include these keywords in your resume to pass ATS screening and impress recruiters.
Must-Have Skills
- Communication
- Time Management
- Statistics
- Problem-Solving
- Data Visualization
Technical Skills
- Python
- SQL
- R
- Machine Learning (scikit-learn)
- Data Visualization Tools (Tableau, Power BI)
Soft Skills
A Day in the Life
A typical day for a Junior Education Data Scientist starts with checking email and responding to inquiries from the team. The first major task is often focused on data cleaning and preparation for a specific project, such as analyzing student performance data to identify factors contributing to academic success. After lunch, the focus shifts to developing a predictive model using Python and scikit-learn to forecast student graduation rates. This involves experimenting with different algorithms and tuning hyperparameters to optimize model performance. The afternoon also includes a meeting with educators and administrators to present preliminary findings and gather feedback. The day concludes with documenting the analytical process and preparing visualizations for a presentation later in the week. Throughout the day, collaboration and communication are key, ensuring that the data analysis aligns with the needs of stakeholders and contributes to improving educational outcomes.
Career Progression Path
Junior Education Data Scientist
Education Data Scientist
Senior Education Data Scientist
Data Science Manager
Director of Data Science
Interview Questions & Answers
Prepare for your Junior Education Data Scientist interview with these commonly asked questions.
Describe a time you had to work with a large, complex dataset. What challenges did you face, and how did you overcome them?
MediumSTAR Method: Situation: I was tasked with analyzing a dataset of student test scores from across the state, containing over 1 million records. Task: The goal was to identify factors that contribute to student success and provide recommendations for improving educational outcomes. Action: I used Python and Pandas to clean and preprocess the data, handling missing values and inconsistencies. I then performed exploratory data analysis to identify key variables and relationships. I built a machine learning model to predict student performance based on demographics, school characteristics, and prior academic history. Result: I presented my findings to the state education department, highlighting specific areas where interventions could be targeted to improve student outcomes. The department implemented several of my recommendations, leading to a measurable improvement in student test scores.
Explain the difference between supervised and unsupervised learning. Give an example of how each could be applied in the education sector.
MediumSupervised learning involves training a model on labeled data, where the desired output is known. For example, predicting student graduation rates based on historical data. Unsupervised learning involves training a model on unlabeled data to discover hidden patterns or structures. For example, clustering students into different learning styles based on their online activity.
How would you approach a project where the data is messy or incomplete?
MediumMy approach would involve several steps. First, I would profile the data to understand the extent of the messiness and incompleteness. This includes identifying missing values, outliers, and inconsistencies. Second, I would implement data cleaning techniques such as imputation, outlier removal, and data transformation. Third, I would document all data cleaning steps to ensure reproducibility. Finally, I would validate the cleaned data to ensure that it meets the project requirements.
Describe your experience with data visualization tools. Which tools are you most comfortable with, and why?
EasyI have experience with several data visualization tools, including Tableau, Power BI, and Matplotlib in Python. I am most comfortable with Tableau because of its user-friendly interface and its ability to create interactive dashboards. I have used Tableau to create visualizations of student performance data, school demographics, and program outcomes. I also have experience with Power BI and Matplotlib, which I use for more customized visualizations.
How do you stay up-to-date with the latest trends and technologies in data science?
EasyI stay up-to-date by reading industry blogs and articles, attending conferences and webinars, and participating in online communities. I also take online courses and work on personal projects to expand my knowledge and skills.
Tell me about a time you had to present complex data findings to a non-technical audience. How did you ensure they understood the key takeaways?
MediumSTAR Method: Situation: I needed to present the results of a model predicting student dropout rates to a school board comprised mostly of teachers and administrators with limited data analysis experience. Task: I needed to convey the key insights of the model, the potential impacts, and recommended interventions in a way they could easily understand and act upon. Action: I avoided technical jargon and focused on the practical implications of the findings. I used visual aids, such as charts and graphs, to illustrate the key takeaways. I also told a story with the data, highlighting specific examples of students who were at risk of dropping out and how the model could help them. Result: The school board members were able to understand the key findings and approved funding for several interventions based on my recommendations. They also praised my ability to communicate complex information in a clear and concise manner.
Discuss a time when your data analysis had a direct impact on a business or educational decision.
MediumSTAR Method: Situation: My team was tasked with evaluating the effectiveness of a new tutoring program implemented in a local high school. Task: Determine if the program had a statistically significant impact on student test scores. Action: I collected data from before and after the program implementation, focusing on the students who participated and a control group of similar students. I ran a t-test to compare the means of the two groups. Result: The analysis showed a statistically significant improvement in test scores for the students who participated in the tutoring program compared to the control group. This data was presented to the school board, who then voted to expand the tutoring program to other schools in the district.
ATS Optimization Tips
Make sure your resume passes Applicant Tracking Systems used by US employers.
Use standard section headings: 'Professional Experience' not 'Where I've Worked'
Include exact job title from the posting naturally in your resume
Add a Skills section with Education-relevant keywords from the job description
Save as .docx or .pdf (check the application instructions)
Avoid tables, text boxes, headers/footers, and images - these confuse ATS parsers
Common Resume Mistakes to Avoid
Don't make these errors that get resumes rejected.
Lack of quantifiable results in resume
Poorly formatted resume with grammatical errors
Failure to tailor resume to education data science
Not highlighting relevant projects or internships
Omitting key technical skills (Python, SQL, R)
Industry Outlook
The US market for Junior Education Data Scientist professionals remains highly competitive. Recruiters and ATS systems prioritize action verbs, quantifiable outcomes (e.g., "Reduced latency by 40%", "Led a team of 8"), and clear alignment with job descriptions. Candidates who demonstrate measurable impact and US-relevant certifications—coupled with a one-page, no-photo resume—see significantly higher callback rates in major hubs like California, Texas, and New York.
Top Hiring Companies
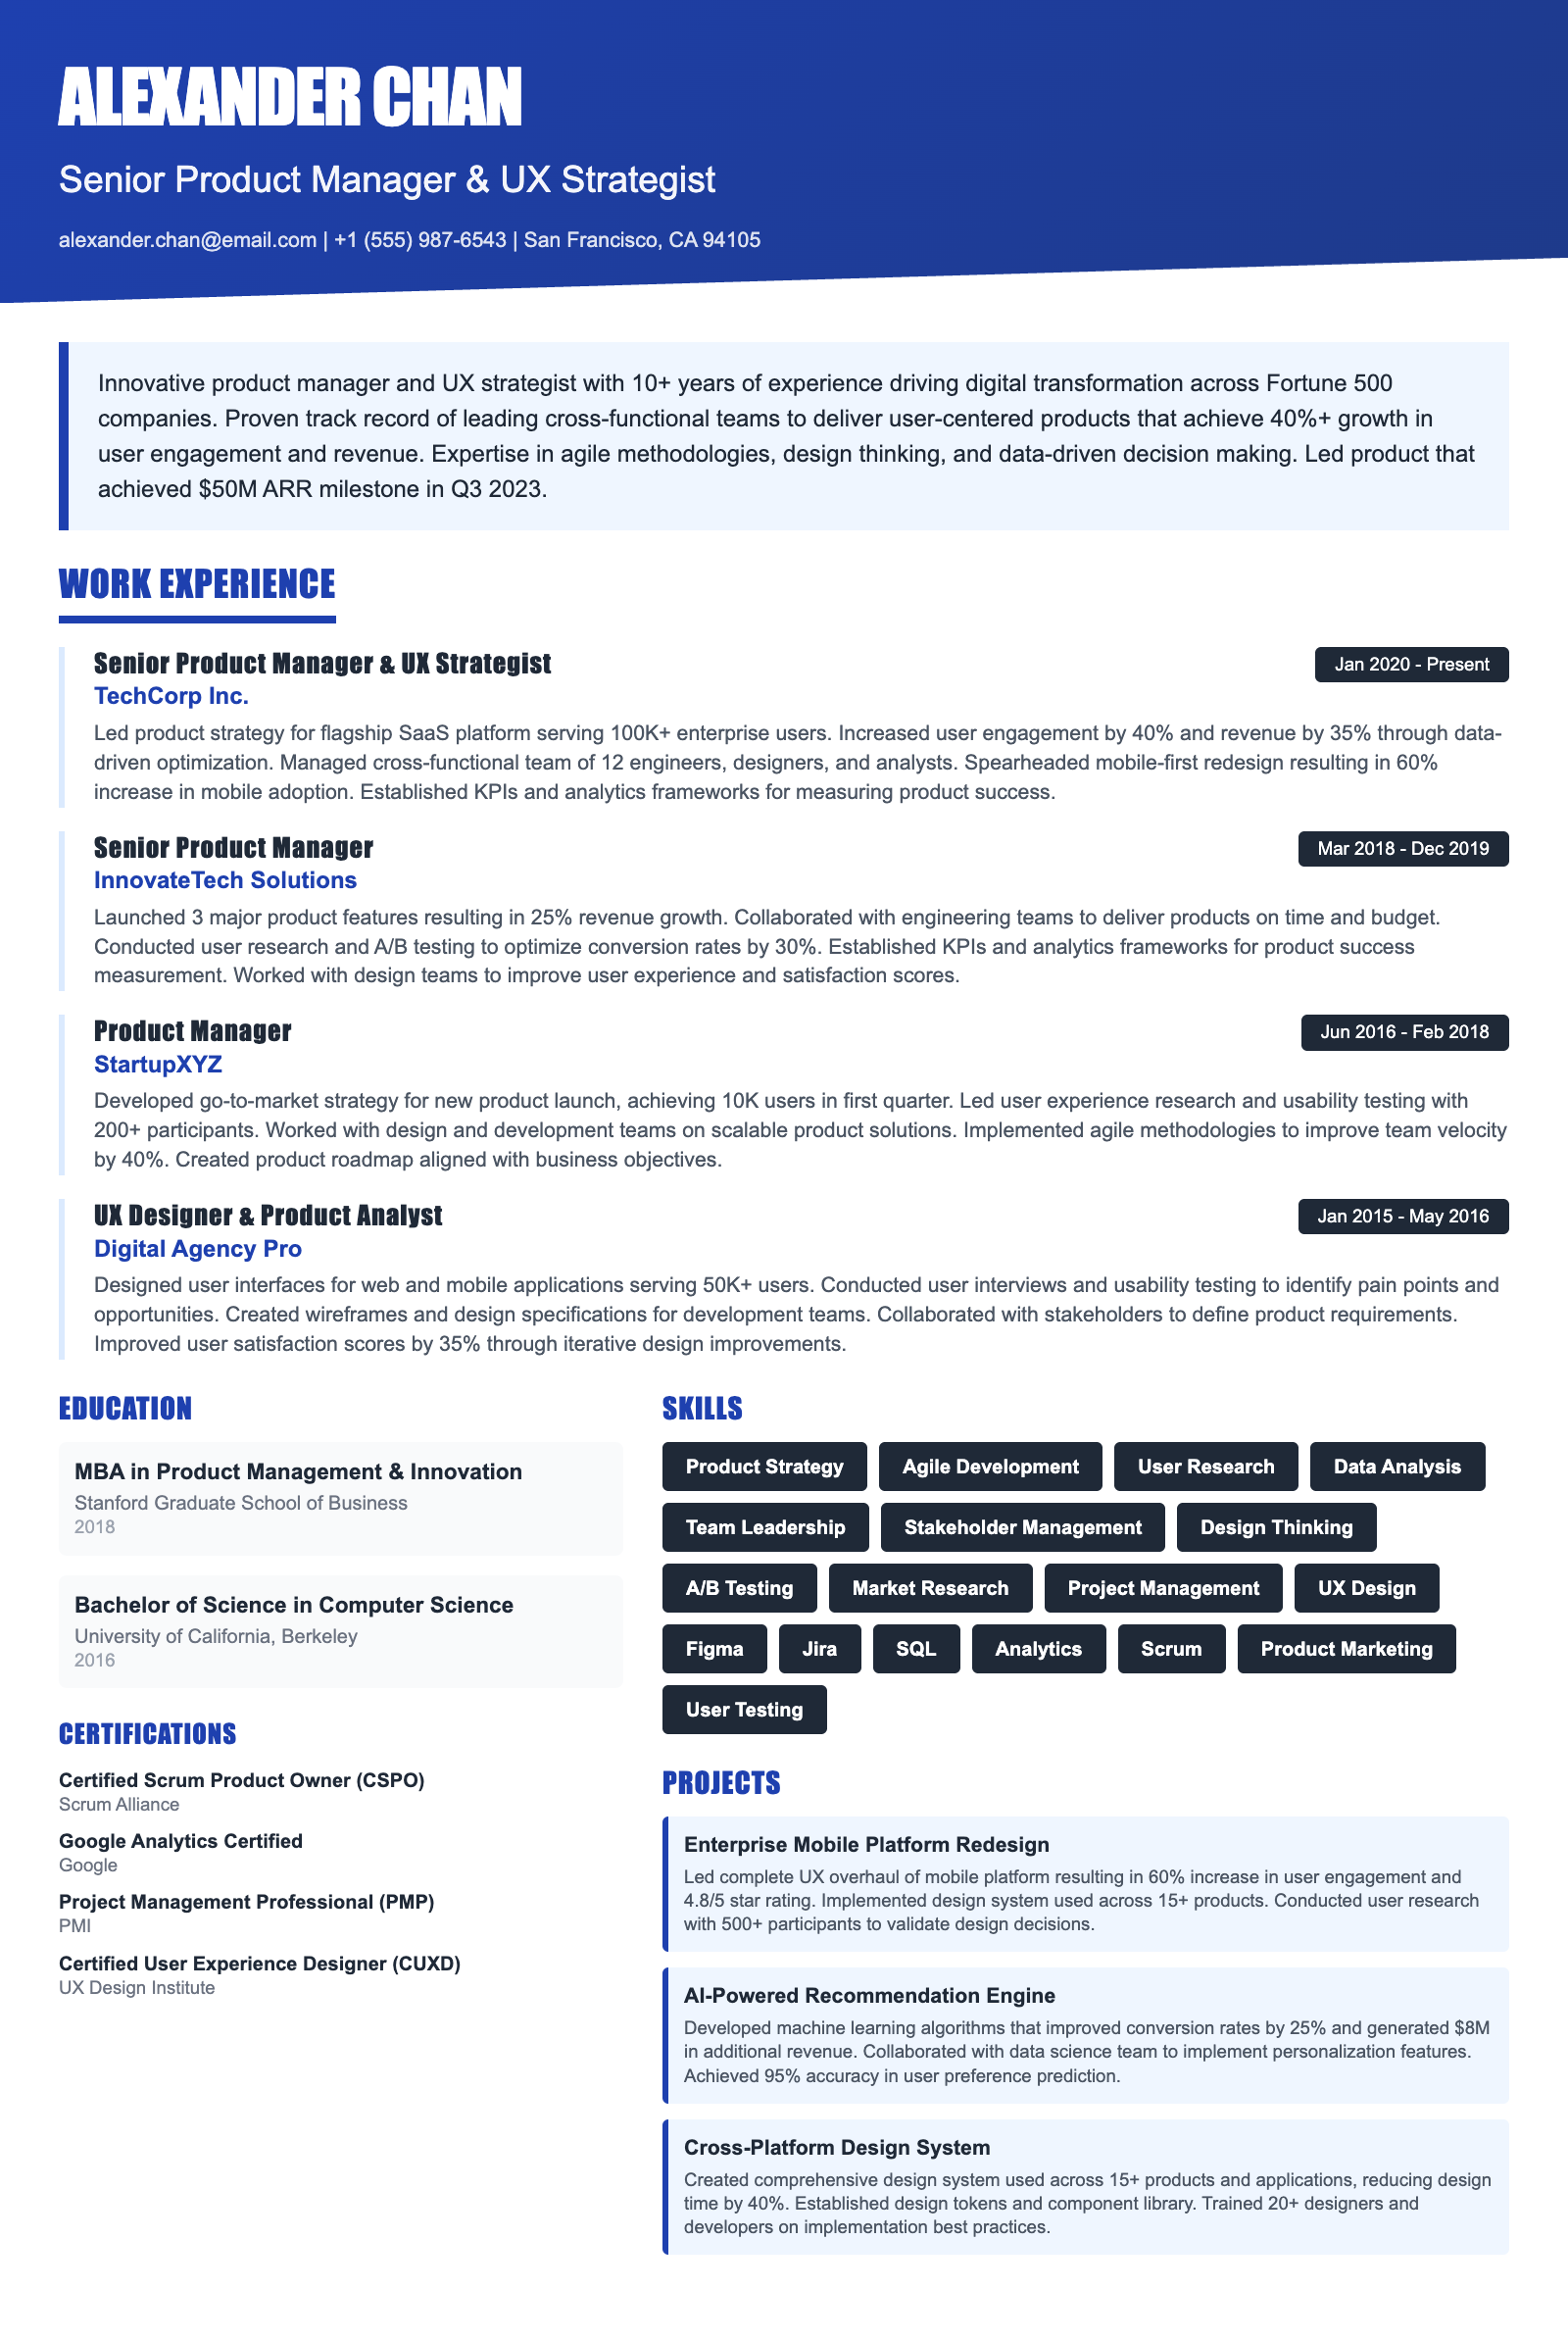
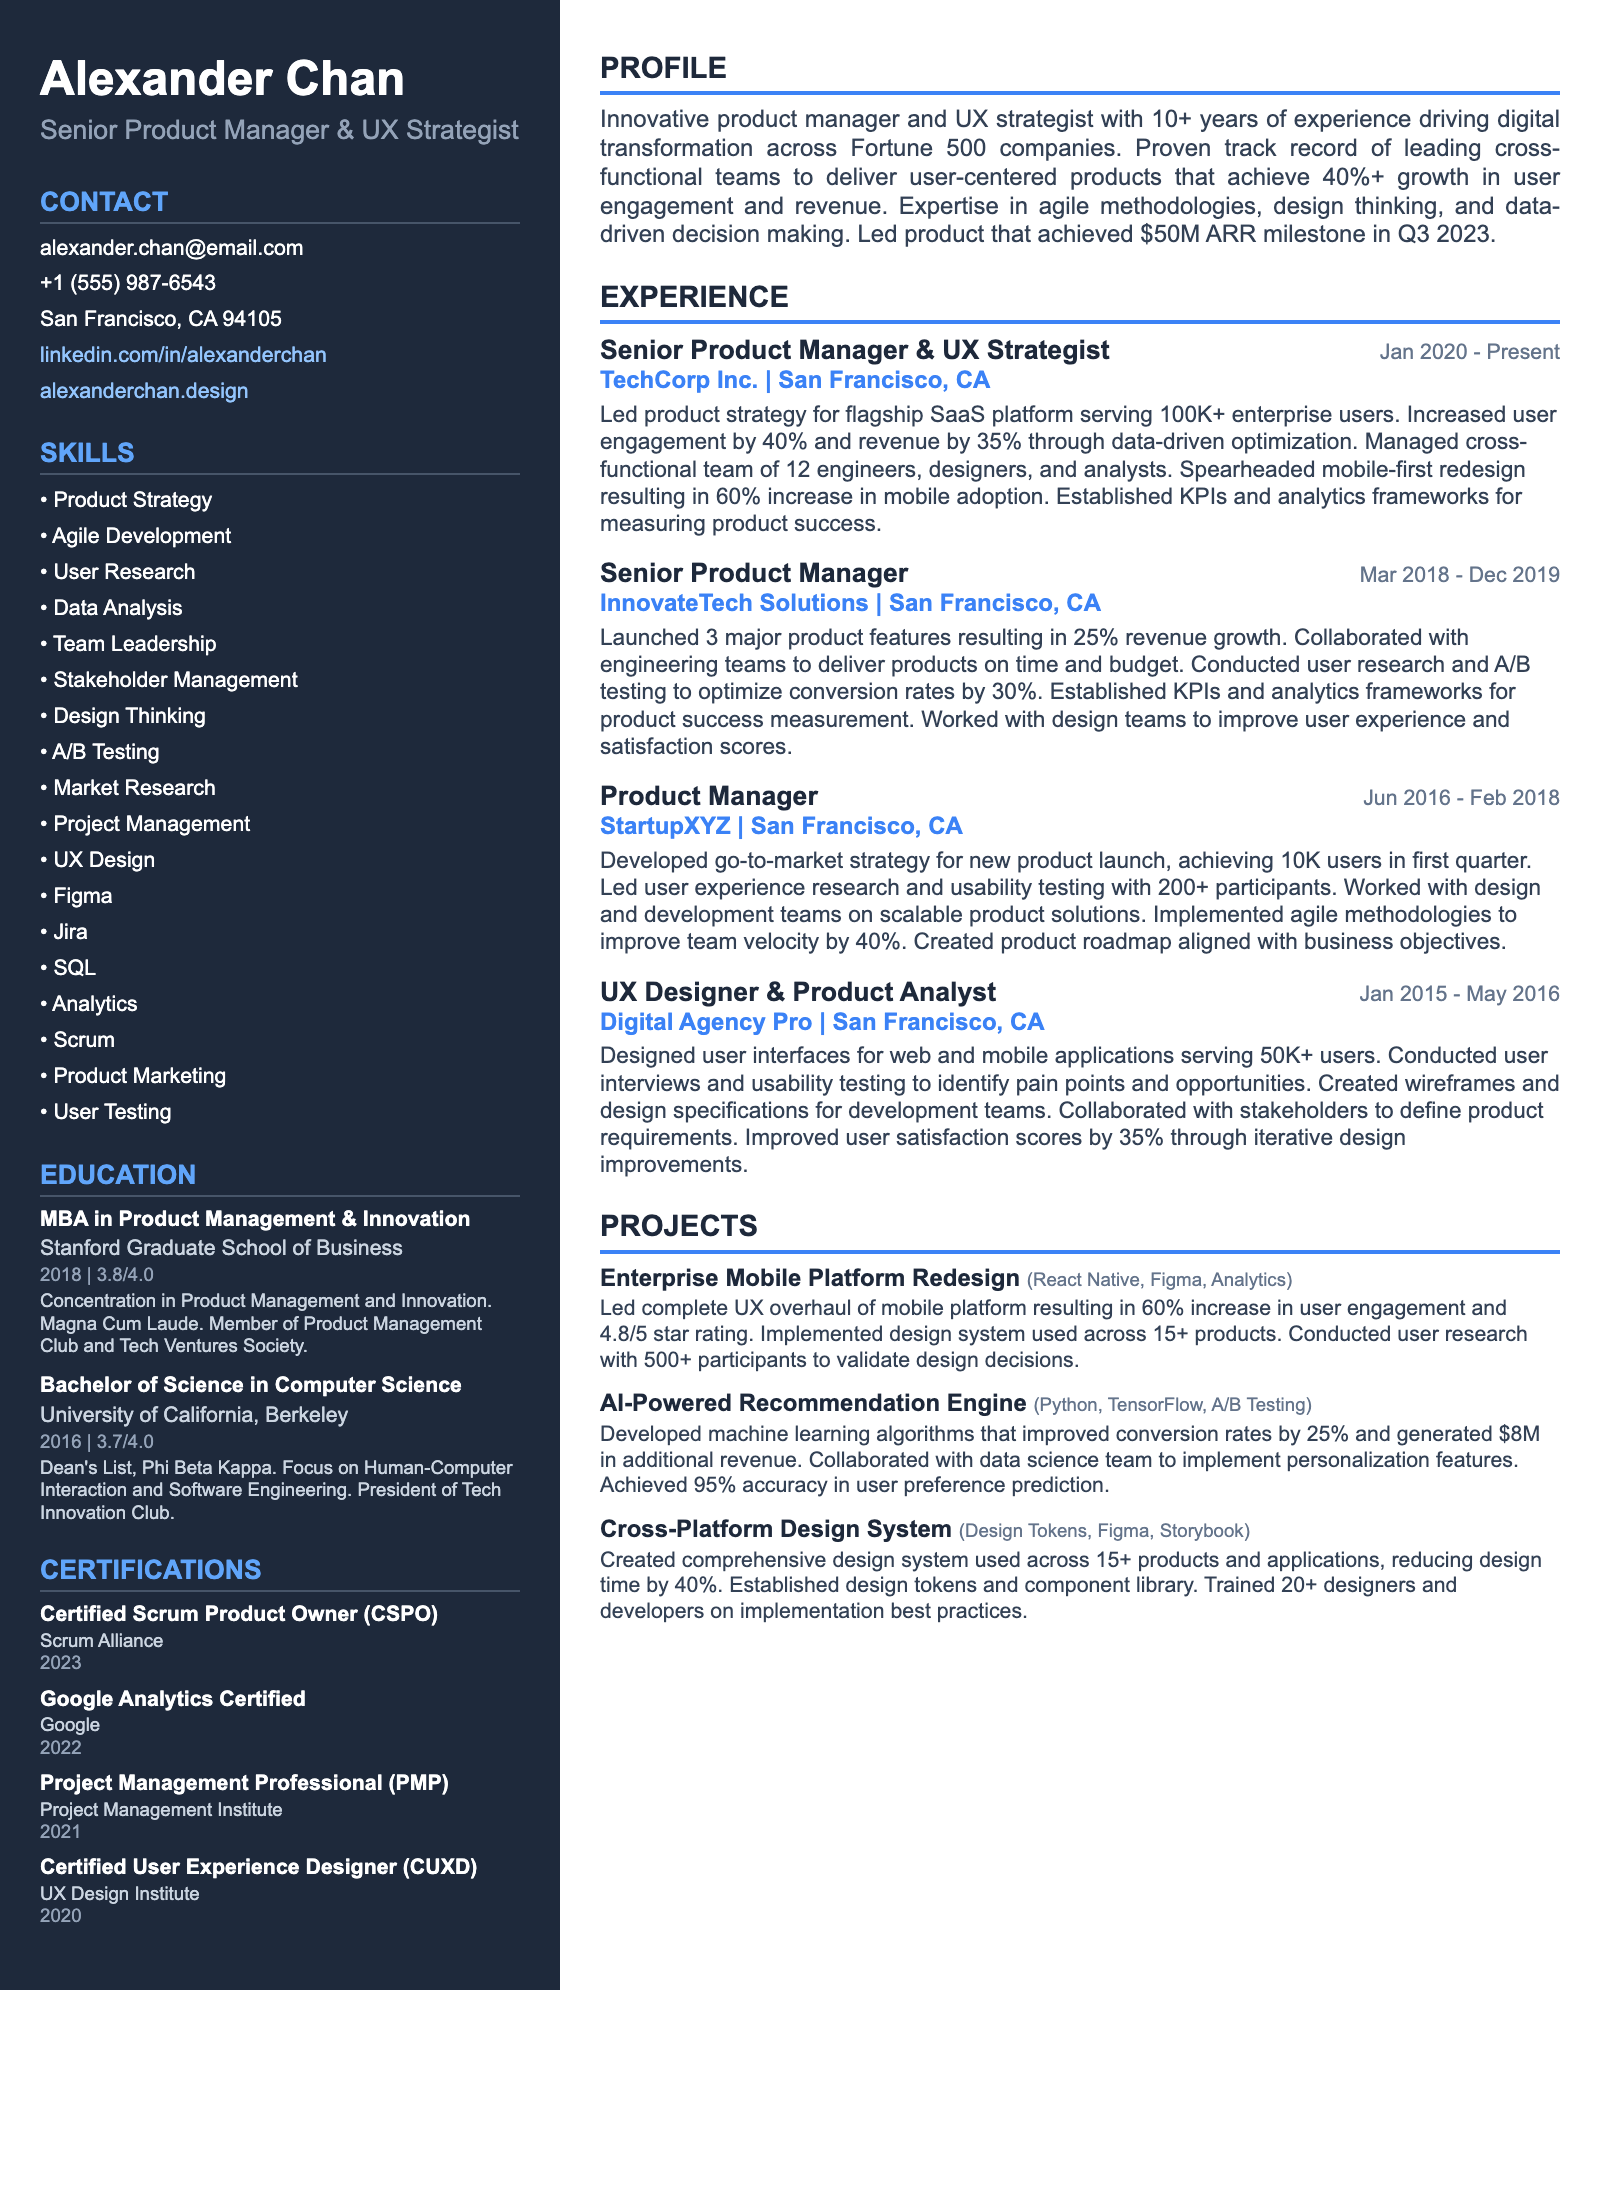
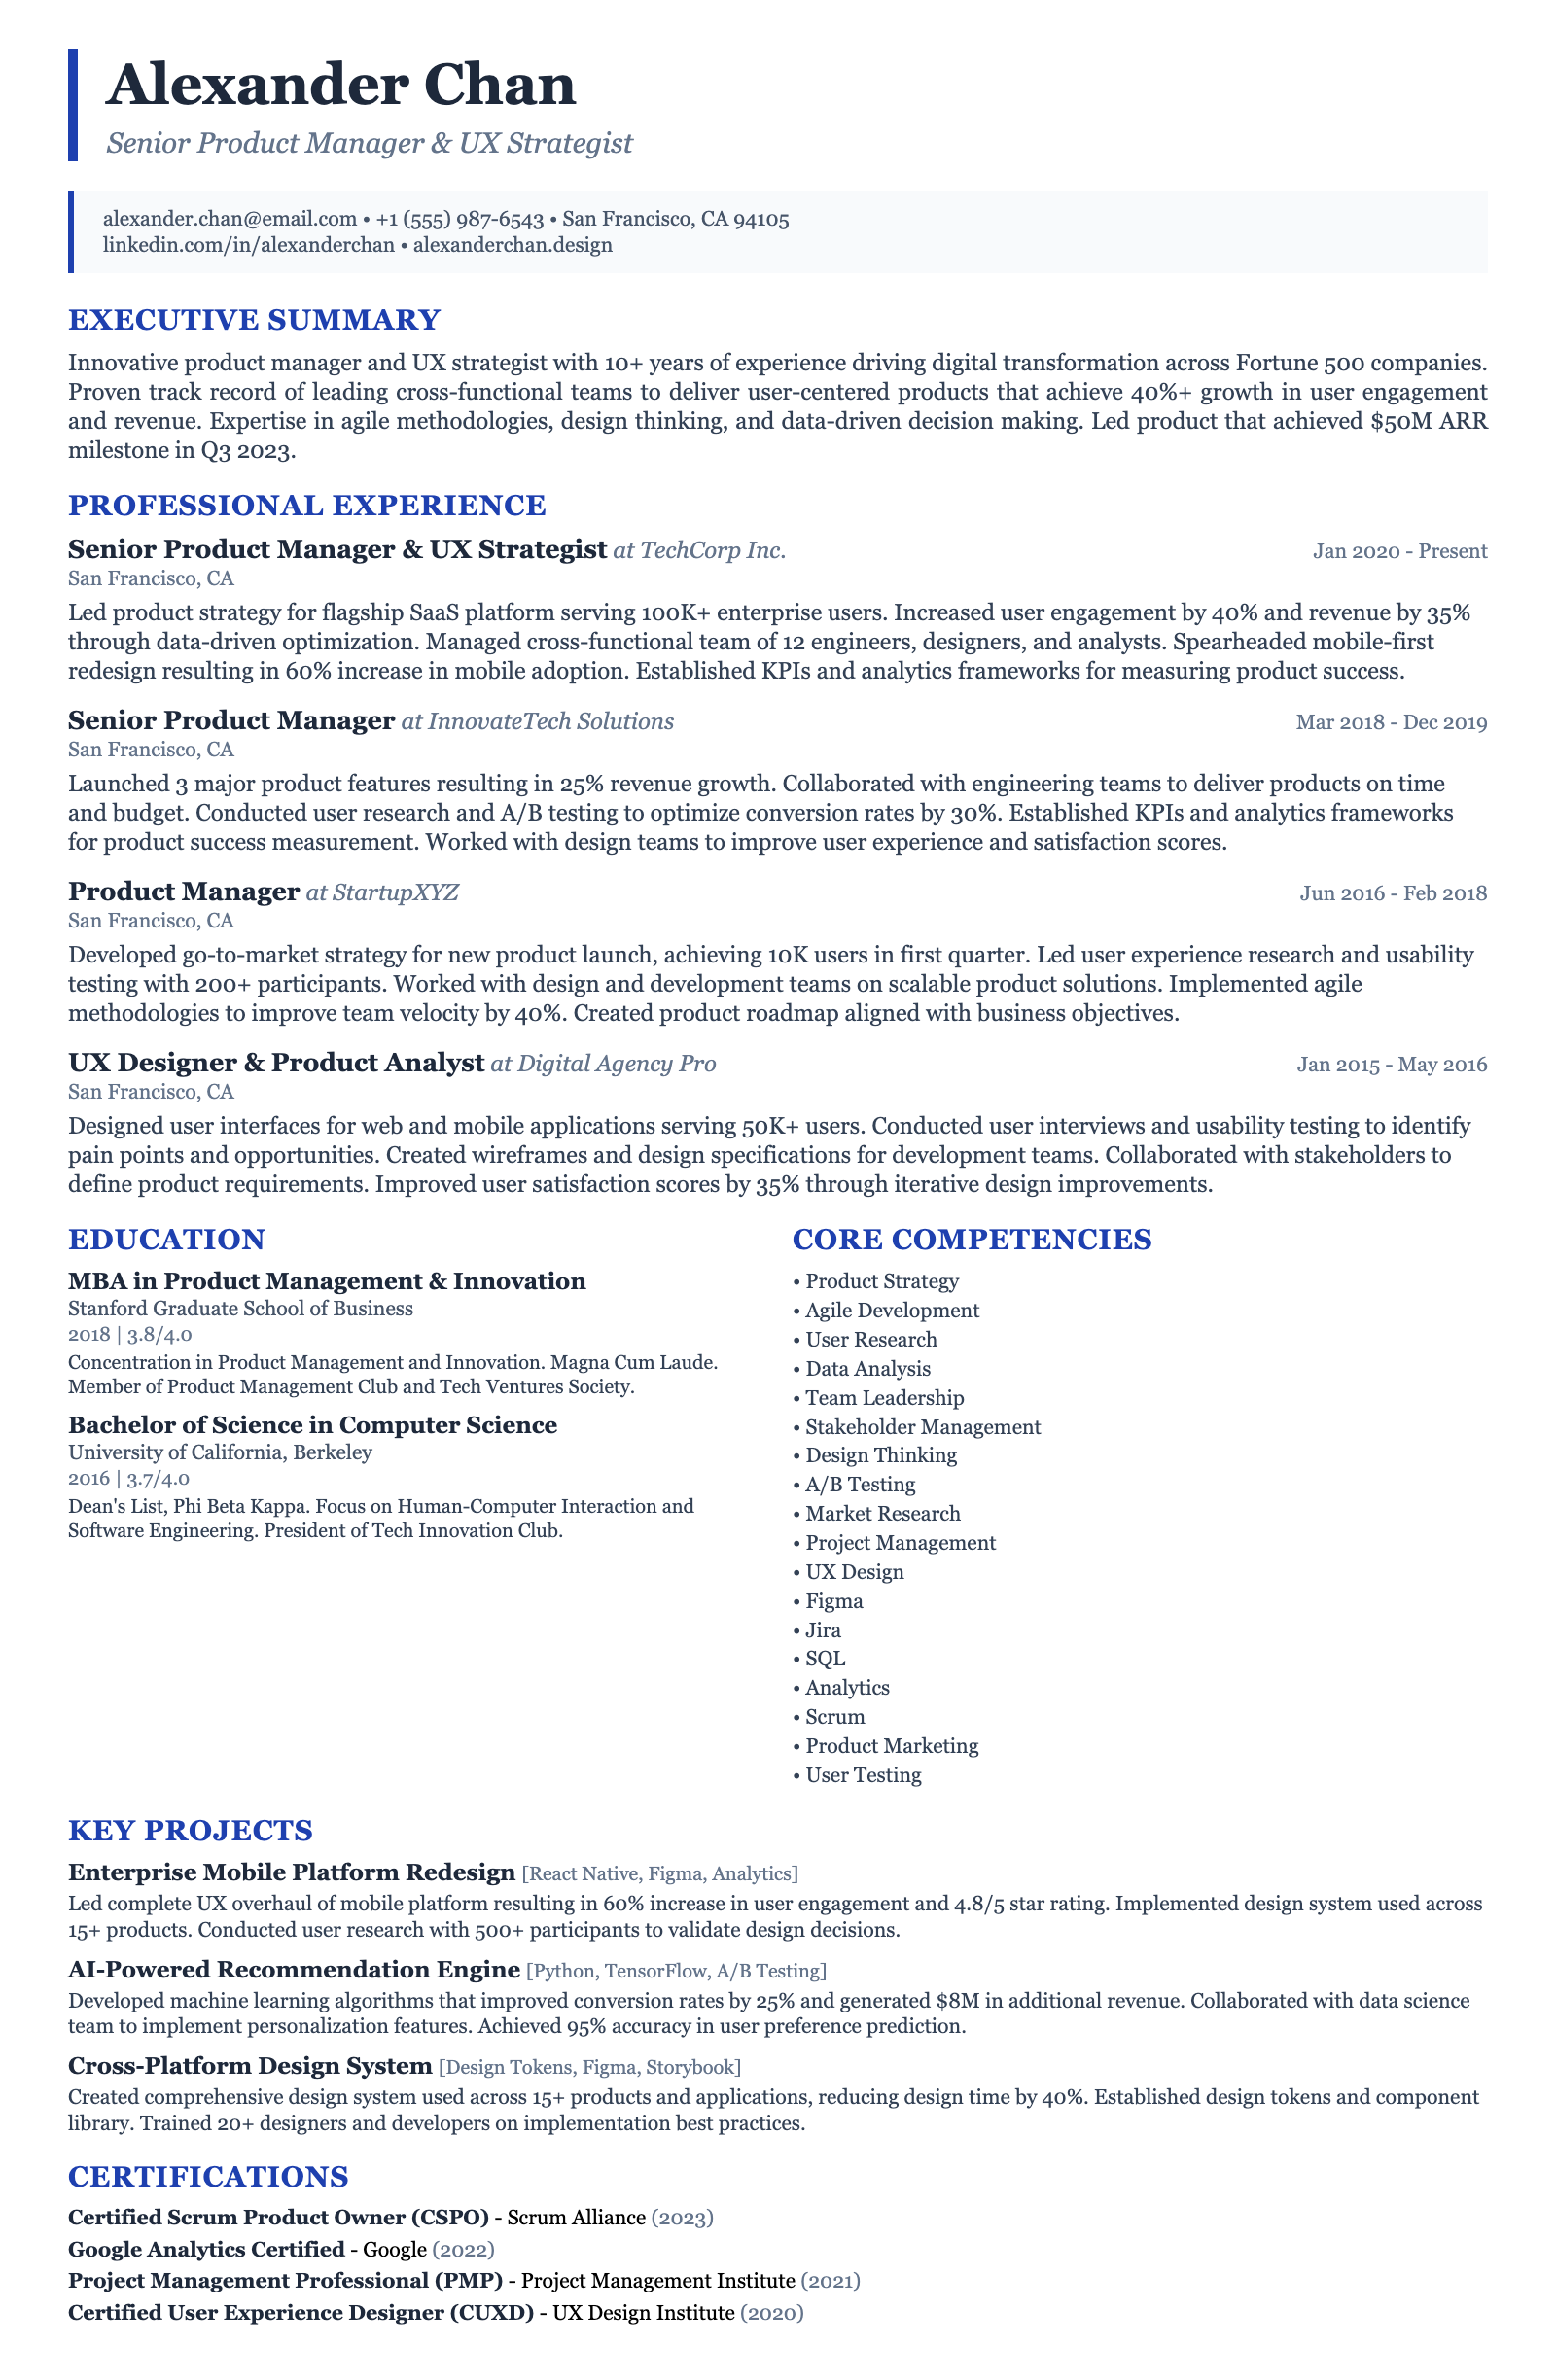
Recommended Resume Templates
ATS-friendly templates designed specifically for Junior Education Data Scientist positions in the US market.
Frequently Asked Questions
What programming languages are essential for this role?
Python is the most important language, followed by SQL for data retrieval. R is also valuable for statistical analysis.
What kind of educational background is preferred?
A bachelor's or master's degree in data science, statistics, mathematics, computer science, or a related field is typically required. Experience in education is a plus.
What are the key qualities of a successful education data scientist?
Strong analytical skills, excellent communication skills, a passion for education, and the ability to work collaboratively are essential.
What is the typical career path for an education data scientist?
The typical career path starts with a junior role, progresses to a senior role, and then to management or leadership positions.
What kind of projects might a junior education data scientist work on?
You might work on projects such as predicting student dropout rates, evaluating program effectiveness, or identifying at-risk students.
How important is domain knowledge in education?
While not always required, having a good understanding of the education system and its challenges is highly beneficial.
What is the work environment like?
The work environment is typically collaborative and fast-paced, with opportunities to work with a diverse team of educators, researchers, and technologists.
What are some of the biggest challenges facing education data scientists?
Challenges include dealing with messy or incomplete data, protecting student privacy, and communicating complex findings to non-technical audiences.
Ready to Build Your Junior Education Data Scientist Resume?
Use our AI-powered resume builder to create an ATS-optimized resume tailored for Junior Education Data Scientist positions in the US market.